Take Pictures & Videos in the Field For Survey and Data Collection With SurveyPocket

At SurveyPocket it’s our goal to create the best mobile research and data collection app in the market. Traditional field methods to collect qualitative and VOC research require people to write comments in or have field researchers carry extra equipment to capture photos or videos, then spending time to cross-reference which comments/pictures go with which survey. With SurveyPocket, you can enhance the mobile field research experience by allowing field researchers and respondents to take pictures and record video clips while collecting survey data.

Instead of forcing a respondent to write a comment, field researchers can now record what respondents are saying right on the spot, or take pictures of what’s happening while the data collection is in process. When was the last time your paper and pen took a picture and video while collecting respondent data?

Ummmm, Never!

As a researcher, what’s more insightful? Reading a bunch of comments on a spreadsheet or watching a series of respondent videos comments? For me, I’d make some popcorn, have my laptop ready to take notes, and watch the videos and note the facial reactions, vocal tones, and hear what they really want to say straight from their mouths.

No doubt, this is a game-changer in the way research and data collection is conducted in the field! And if you haven’t jumped on the board with SurveyPocket then you are missing out on great data collection opportunities that a pen and paper cannot capture. Your field team can never remember all the details of their interaction with field respondents. Recording and photos will liven up any field project to your data-driven project.

How long does it take to set up video and image capturing question types to use on the SurveyPocket App?

It takes 5 simple steps to set up an image/video in your field survey.

Step 1: To add an image or video capture question go to:

Attach/Upload File -> Click on Data Input Type:  Choose either Photo or Video
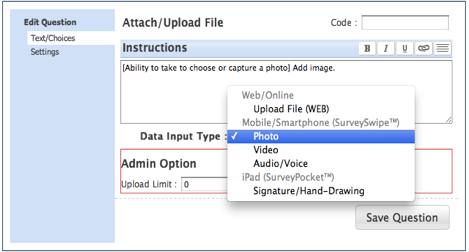
Step 2: Add Instructions for the video or photo

Step 3: Complete the rest of your survey and make sure to your survey is assigned a device key from the Mobile tab.

Step 4: Pull up the SurveyPocket App, add the device key, and click on the synchronize button to pull up the survey to begin fielding.

Step 5: Follow instructions to capture image. You can take more and 1 image if needed that time and also move, rescale, or retake a picture if needed.

Example of picture taken on the iPad while taking the survey:

Here is a fun example of Video Capture question done on the iPad 2 using SurveyPocket. I was at the annual Fremont Solstice Festival in Seattle, WA this past June and took a few pictures of what was featured during the parade with the iPad.

I then proceeded to interview a couple next to me and asked them what they liked about the Fremont Parade this year. Click on their picture I took of them with SurveyPocket to hear what they enjoyed about this year’s parade.

What did you like about 2011's Fremont Solstice Parade in Seattle, WA?

How can I access the pictures and videos captured in the field with SurveyPocket?

Go to:

Login »  Surveys »  Reports »  Data Management »  Response Viewer

Search the database and click on the Response ID link to open up the individual responses. You can go to the Upload/Attach question and download the file from the link provided.  Click on the respondent ID to pull up the link to view photos or video.

To learn more on how to use SurveyPocket for field research or data collection, or to set up a free trial demo of SurveyPocket go to http://www.surveypocket.com or click on the logo below to view & download SurveyPocket to your iPad today!


Market Research about Tablets, iPads and Smart Phones Shows High Adoption Rates

In my search for giving you something useful and worthwhile to read, I discovered some very interesting research stats on tablets and iPads.

It’s no surprise that these new devices have changed how we communicate – but they’ve also created a new experience for users; one that has actually changed their behavior, made them more open to advertising and resaerch as well as purchasing.

Check out some of these stats and see how you can take advantage of some of this revealing information.

The Power of the Tablet

  • A recent online survey found that 12% of today’s US online population currently owns or uses a tablet device and an incremental 11% intend to purchase a tablet device in the next 12 months. 
  • Currently only 4% of US households have a tablet.
  • Juniper research states that tablet sales will soar to 80 million units in 5 years.
  • The number of tablet users is projected to grow to 23% by early 2012-a group that represents an estimated 54 million people 87% of tablet users are accessing content and information.
  • 79% of app downloaders have paid for apps in the last 12 months; 26% of all apps downloaded are paid.
  • On average, those who have downloaded apps on tablets have spent $53 on apps in the past 12 months. In addition to iTunes, Amazon and Google, 29% of tablet users would prefer to buy apps from their cable company or internet provider and 25% would prefer to buy their apps directly from publishers.
  • 60% of tablet users are males; 48% are 18-34 years old 43% of tablet users have incomes in excess of $50,000 56% of tablet users who watch video watch full-length TV and 55% watch full-length movies.
  • More than 50% of tablet users say that tablets are ideal for researching products and making purchases.
  • Pew Research says that tablets are most popular for consumers aged 56 and younger.
  • Tablet users have most likely made multiple purchases: Tablet users are more likely than smartphone users to say they have made three to five, six to 10, and more than 10 online purchases in the last six months.


iPad Users

  • Sixty-five percent of them are male and 63% of them are younger than the age of 35.
  • iPad owners have positive response rates roughly double those of iPhone and overall connected device owners
  • iPad owners are more likely to make a purchase based on an ad
  • Nielsen research shows that 50% of both iPad and iPhone users earn $75,000 or more annually.  In contrast, about 30% of all mobile subscribers earn more than $75,000 annually.
  • 63% iPad users have paid to download an app. In addition, only 5% say they only download free apps, suggesting a high willingness in this group to pay for applications.
  • Apple’s iOS platform has nearly 38 million users, outreaching the Android platform by 59%

Smart phones and shopping experiences

  • According to a comScore study in March of 2011, 16.7 million U.S. mobile subscribers used location-based “check-in” services on their phones in March 2011, representing 7.1 percent of the entire mobile population. 12.7 million check-in users did so on a smartphone
  • 31% US smart phone owners who use their device for shopping frequently/often access promotional coupons in-store for in-store redemption.
  • Nearly 50% of respondents stated “awkward shopping experience” as the barrier that kept them from making purchases via smart phone device
  • Smart phone users haven’t downloaded any shopping apps in the last year.

What interestin stats have you seen about tablets, iPads and smart phones?  Share your resources with us!

Take Pictures & Videos in the Field For Survey and Data Collection With SurveyPocket

At SurveyPocket it’s our goal to create the best mobile research and data collection app in the market. Traditional field methods to collect qualitative and VOC research require people to write comments in or have field researchers carry extra equipment to capture photos or videos, then spending time to cross-reference which comments/pictures go with which survey. With SurveyPocket, you can enhance the mobile field research experience by allowing field researchers and respondents to take pictures and record video clips while collecting survey data.

Instead of forcing a respondent to write a comment, field researchers can now record what respondents are saying right on the spot, or take pictures of what’s happening while the data collection is in process. When was the last time your paper and pen took a picture and video while collecting respondent data?

Ummmm, Never!

As a researcher, what’s more insightful? Reading a bunch of comments on a spreadsheet or watching a series of respondent videos comments? For me, I’d make some popcorn, have my laptop ready to take notes, and watch the videos and note the facial reactions, vocal tones, and hear what they really want to say straight from their mouths.

No doubt, this is a game-changer in the way research and data collection is conducted in the field! And if you haven’t jumped on the board with SurveyPocket then you are missing out on great data collection opportunities that a pen and paper cannot capture. Your field team can never remember all the details of their interaction with field respondents. Recording and photos will liven up any field project to your data-driven project.

How long does it take to set up video and image capturing question types to use on the SurveyPocket App?

It takes 5 simple steps to set up an image/video in your field survey.

Step 1: To add an image or video capture question go to:

Attach/Upload File -> Click on Data Input Type:  Choose either Photo or Video

Step 2: Add Instructions for the video or photo

Step 3: Complete the rest of your survey and make sure to your survey is assigned a device key from the Mobile tab.

Step 4: Pull up the SurveyPocket App, add the device key, and click on the synchronize button to pull up the survey to begin fielding.

Step 5: Follow instructions to capture image. You can take more and 1 image if needed that time and also move, rescale, or retake a picture if needed.

Example of picture taken on the iPad while taking the survey:

Here is a fun example of Video Capture question done on the iPad 2 using SurveyPocket. I was at the annual Fremont Solstice Festival in Seattle, WA this past June and took a few pictures of what was featured during the parade with the iPad.

I then proceeded to interview a couple next to me and asked them what they liked about the Fremont Parade this year. Click on their picture I took of them with SurveyPocket to hear what they enjoyed about this year’s parade.

What did you like about 2011's Fremont Solstice Parade in Seattle, WA?

How can I access the pictures and videos captured in the field with SurveyPocket?

Go to:

Login »  Surveys »  Reports »  Data Management »  Response Viewer

Search the database and click on the Response ID link to open up the individual responses. You can go to the Upload/Attach question and download the file from the link provided.  Click on the respondent ID to pull up the link to view photos or video.

To learn more on how to use SurveyPocket for field research or data collection, or to set up a free trial demo of SurveyPocket go to http://www.surveypocket.com or click on the logo below to view & download SurveyPocket to your iPad today!


How To Represent For Your Demographic

Why is it important to collect a survey-taker’s contact information? Well, there are a lot of reasons why giving your contact information helps surveyors. With SurveyPocket’s new ability to collect contact information, we’ve added the efficiency for defining demographics, which gives SurveyPocket yet another advantage for a wider range of survey types.

Each address or name is selected at random to represent hundreds or thousands of others. We are not able to substitute another name or address for yours, and if you don’t participate it means that people like you are less represented in the information we provide to decision-makers. Your participation is voluntary but we encourage you to consider the important uses of the data we collect. Your information will be combined with other participants in the form of statistical data and your identity will never be connected to your responses.

How to add a Contact Information type question for SurveyPocket:

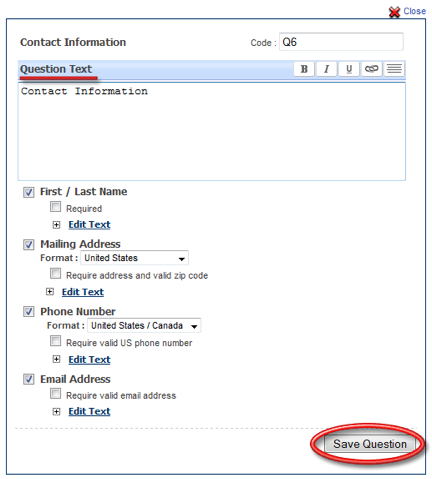
Click on the Add New Question button and select the Contact Information question type option from the Standard Questions drop menu.

Select contact information type to be added by respondent

On SurveyPocket the question will display as follows:


Hey Old Guys — Your Customers Expect Mobile Marketing

push pull two men at opposite sides of doorSurvey Analytics’ Executive VP (and self-proclaimed old guy) has a fantastic article on Research Access that talks about mobile devices and how they are used by people over 40 and under 40.   At a recent client meeting, he asked the old guy how many apps they had and the young guys.  As it turns out the young folks had lots — like 50 or so and the old guys not nearly as many.  The old guys were using their smart phones more like phones and less like computers.

Do you want to be in business 20 years from now?

I’m not trying to be flip with this question.  It’s a valid question.  If you intend to be in business twenty years from now, then you have to be keeping pace with how the twenty-year-olds are making buying decisions.  Right now, the average 11 year old has at phone with a texting keyboard at the very least.  As they get older and become active on Facebook, they don’t even get an email – they just use their Facebook app.  This isn’t a trend — this is reality.

These kids will be your customers in a few years, and if you don’t have a way to interact with them via mobile device, you will not exist for them.  This isn’t conjecture — it’s demographics.  Unless of course, we experience an EM Pulse that wipes computers off the grid and then we’ll be back to sidewalk signs.  But until then, you will need to find ways of interacting with your customers using a mobile device.

How to use mobile apps and tools to engage your customers

If you have the kind of business that hasn’t attracted your customers to social media sites for business – you are not immune to the need for participating in mobile marketing.  Just for fun, I’ve decided to breakdown the traditional marketing process and show you how you can use mobile marketing strategies and tools to grab those customers.

Market Research

Survey Analytics has a fantastic system that no one has been able to beat for mobile market research.  It starts with their powerful MicroPanel module (this isn’t mobile or required, but believe me – it will put your marketing on turbo).  Use MicroPanel to create a customer panel or community of customers and/or prospects.  Giving your customers the opportunity to participate in an advisory panel not only makes research easy – but engages your customers in a way that makes them more loyal and more profitable.

Now you are ready to introduce your customers to the SurveySwipe mobile app.  SurveySwipe is the ONLY market research mobile app that runs on EVERY mobile device platform.  SurveySwipe runs on iPhone, Android, BlackBerry and Microsoft!  You know what this means — no one is left out.  That’s a good thing.

Your customers will love SurveySwipe because they will earn points and rewards.  Anything from apps to Amazon points.  If you like — YOU can earn money by giving your customers the opportunity to participate in other surveys for which they are a good fit.

When you run mobile surveys with customers that are part of a panel — you can ask them one question or three questions at a time.  You can ask more if you like — but why would you — all of their answers are saved as part of their profile.  This means that the data is ALIVE!

Living data means that you can get into the database, ask it questions and it gives you the answers.  You save money and time because you may not have to run a survey – run a query instead.  As your customer panel answers more and more questions, you may run fewer surveys to get answers.

Segmentation, Targeting and Positioning

Do I even need to get into how powerful a tool mobile surveys can be in profiling, grouping and targeting customers?  Using the Survey Analytics platform to analyze your mobile data can uncover opportunities within segments that you may not have considered.  Whenever someone downloads the app to take your survey, they become part of your panel.  Not only that, but because they are participating from a mobile device, you KNOW that they are who they say they are — your panel has integrity and you know that you can trust the responses.

Taking quick surveys on mobile devices almost creates a conversation that encourages respondents to share psychographic information more readily.  The SurveySwipe app also allows respondents to upload pictures of products that they are using so that it’s almost like running a virtual focus group (ok – maybe a slight exaggeration on that one) but the idea of having relatively real time picture uploads of what your respondents are doing and the brands they are interacting with tells you something

Offering Development – Building the Marketing Mix

The four P’s have never been so powerful as when you are using mobile devices to develop your product, price, promotion and distribution using mobile apps.  Mobile apps and surveys can integrate with Facebook and that means that your customers can pass the survey on to their friends, who pass it on to their friends — yes viral surveys.  This not only builds your panel, but it gives you more data about the things that your customers want to see in your product or service.

This won’t make conjoint or TURF analysis go away, but it will allow you more on-demand kinds of interactions with your customers.  The more you engage them and make your customers feel like they make a difference  the more they will value your company. difference difference can give you results in an hour or less — it’s not statistically valid right away — but it gives you research, data and a solid foundation upon which to build real research to help you make better decisions.

If you haven’t considered using mobile apps as part of your market research plan, then you really need to take a deeper look.  Head over to the SurveySwipe page and see what this app can do for you.

Does this sound like a hard sales pitch — don’t take it that way — I’ve been a Survey Analytics customer for over 6 years and have use this app for myself.  I’m blown away by the function, the customer experience and the response rate.  And this is why this article sounds the way it does.

Why Mobile Marketing Strategy is More Important Than Ever

HubSpot, the gurus of inbound marketing, ran an article this week that outlined 5 reasons for mobile marketing.  After looking at their reasons for jumping into the mobile marketing pool, I was inspired to come up with some reasons or applications of my own.

But first, I think it’s worth noting that we should be at the point of recognizing that it’s not about whether or not you should be doing mobile marketing.  The information that’s out there proves without a doubt that “IF” is not the question, but rather “HOW” to make mobile devices a more powerful marketing tool for your organization and an engagement and buying vehicle for your customer.

First some facts.  I pulled this from HubSpot’s post:

According to eMarketer, there will be 73.3 million smartphone users in the U.S. in 2011. And that number is only rising. It’s estimated that there will be more than 84 million by 2012 and over 100 million by 2014.

But here’s the number that really gets me. According to Michael Tasner in his book “Marketing in the Moment,” only 6% of businesses are doing any type of mobile marketing. And for companies with less than $10,000 in revenue per year (what we at HubSpot consider small businesses), only 0.5% of them mobile market. The book was published a year ago, so these numbers might be up a little, but not by much.

Really take a moment to think about these numbers and what they mean.  EVERYONE and their mother has – and is using a mobile device.  In fact, I can’t remember what study came out recently that said that people are actually looking at their mobile devices BEFORE they get out of bed to do anything else!

Nearly 100 million people in the world are attached to their mobile devices and less than a fraction of small businesses is communicating with their customers in this way.

Now you see why I say this isn’t an “IF” question but a “HOW” question.  Let’s get to it.

#1: First to Market.  The basic rule of marketing that he who gets there first makes the most money applies to this situation.   This field is a wide open space and keyword phrases and words that are secured in other areas are available in this space.  There are currently advertising opportunities via apps as well as the opportunity to engage with customers for whom this is still new.  Remember the days when people were making a killing with email marketing before spam started — yeah — that’s where we are in this space.  Start looking into this.

#2: Customer engagement.  High customer engagement equals higher profits.  Google’s latest independent research, 74% of smartphone users have made a purchase as a result of using a smartphone. When it comes to search, 53% of smartphone users purchase something as a result of their smartphone search. That’s 53% of 73 million.

#3:  Lead Generation  Your customers have their phones with them all the time.  And they are willing to share slices of their time to make purchases OR answer questions.   You may not have thought about using surveys as a lead generation or qualifying tool before, but that’s exactly what it becomes.  When your audience downloads the SurveySwipe application and answers a series of profiling questions — they are in, essence qualifying themselves for future products or services.  When you ask them questions about specific preferences, wants or needs, they are taking themselves through a sales process.  If you integrate your product and service into the SurveySwipe rewards program, you are attracting your ideal customers and drawing them into new purchases by simply engaging with them via mobile device.

#4: Seamless integration. There is no questions that people want to be seamlessly connected.  They want to move from desktop to laptop to mobile device without skipping a beat.  Using the combination of SurveyAnalytics MicroPanel, IdeaScale and SurveySwipe you have the only platform on the planet that will allow for that kind of integration as it relates to gathering customer preferences and feedback.  Not only that, it doesn’t occur to them as an intrusive survey – it’s a conversation, it’s idea generation, and the ability to customize their own experience with your organization.

#5: Ready-to-Use.  It used to be that only the multi-million dollar budgets could afford to use an integrated system like this.  But now DIY marketers can use it too.  The only difference for the low-budget set is that you will have to spend a little more time managing the pieces and parts.  Larger organizations will find this system appealing because it’s ready to be customized, white-labeled and used within your marketing strategy right away.  It’s a flexible system that you can make your own.

Mobile marketing is a trendy phrase right now — but don’t be fooled.  It’s just another way to connect with your customer, be within arm’s reach and sell them stuff.  Your customer wants a seamless customized experience and you will have to figure out how to deliver it.  Don’t forget to use mobile devices as a vehicle to get that done.

Results of the Presidential Job Index Survey (week ending 6/24/2010)


Quick update on the results for the presidential job index survey for the week ending 6/24/2011. As a reminder this is a weekly survey that we conduct and we publish the results for the survey every Friday. To participate in this week’s survey, please download the SurveySwipe application and take the survey.

Remember, you get points that you can redeem for various rewards when you take our surveys. We have already distributed several paid apps like Angry Birds for free.

Highlights

  • Almost 1000 respondents took the survey, 10% more than last week.
  • 55% vs 54% last week of the respondents approve of the job that President Obama is doing.
  • Respondents included 31% Democrats (29% last week), 22% Republicans (same as last week), 27% independents (26%) last week and 1% with the Green Party (3% last week).

You can view the reports here or directly on your phone.

Is Product Proliferation Killing Your Profitability?

Product proliferation is often a function of improving customer service and experience.  A customer says they love product A and would buy millions of them — if only you could change the color from black to green.

From that point on, it’s a slippery slope to where if one customer can make a special request, then another makes a special request.  The next thing you know, you’re managing an ever increasing number of SKUs (Stock Keeping Units) and the amount of paperwork and quality system management has gone up exponentially.

What you may NOT notice is that product proliferation creates a quiet profitability leak .  Over time, that customer that said they would buy millions of units, only ends up buying a couple hundred thousand.  And in a couple of years, the number of units starts decreasing and before you know it, your profit margin is as thin as a human hair.  Even worse, you may not even notice how many products you have that fall into this category.  All you see is a steadily shrinking margin.

In the past, companies had two choices; discontinue the products that don’t meet margin levels and risk losing customers or keep unprofitable products and risk losing their business to bleeding profits.  This often found the sales and marketing folks in conflict with manufacturing or finance departments.

But there is a way to to reach a compromise between these two sides — you can actually get your customers to choose which products they want to keep and which products they want to ditch.

Get Your Customers to Choose the Product Offerings They are Willing to Pay For

Conjoint analysis is a statistical technique used in market research to determine how people value different features that make up an individual product or service.  It’s a great methodology for product rationalization because it gives customers the ability to choose what features they want at what price.  Is having their widget available in blue worth a 50% price increase?

Set up your conjoint questions by describing the different product choices in terms of features and the different levels for each feature.  For example, if you’re trying to determine what TV’s to sell, you would identify the different features that are available i.e. screen size, format,  and price. Then list all the levels or options for each feature such as LCD, LED formats and price levels.

The Survey Analytics Conjoint Analysis module will then create options for your respondents to choose from.  Respondents will choose their favorite offering mix or rate the available offering mixes.  The results will tell you exactly which product offering they value most and the price they are willing to pay for each offering.

Ultimately, you may find yourself retaining products you might have eliminated because customers are willing to pay a higher price for specific features.

Conjoint analysis used to be a time intensive, error-prone and expensive research method.  But today’s technology has made it much easier to create, run and analyze the data.

If you’ve got too many products to maintain that have increased complexity and decreased your bottom line – running a conjoint analysis on your products will not only get your customers engaged in the process – you’ll feel good about cutting products that your customers don’t value and keeping the ones they do at an increased price.

SurveyPocket App Adds Rank Order Survey Question While Offline

As SurveyPocket evolves, we’re seeing exciting offline question type support continue to increase. One of the latest offline capabilities added is Rank Order question functionality, which allows survey takers to rank items in order of preference by selecting a numeric value for each answer prompt.

Are you familiar with doing field research? Imagine conducting survey after survey, carrying and collecting all of that paper, just to have to later input the collected data into your online account . Now imagine carrying an iPad, with no worries of internet since SurveyPocket supports fully offline abilities. Later, once you have internet, just sync your iPad with your online Survey Analytics with a touch of a button.

Try it out. It’s free!

Rank Order Question on SurveyPocket

How to add a Rank Order Question and view in SurveyPocket?

Step 1: Under the Edit Survey page click on the Add New Question link:

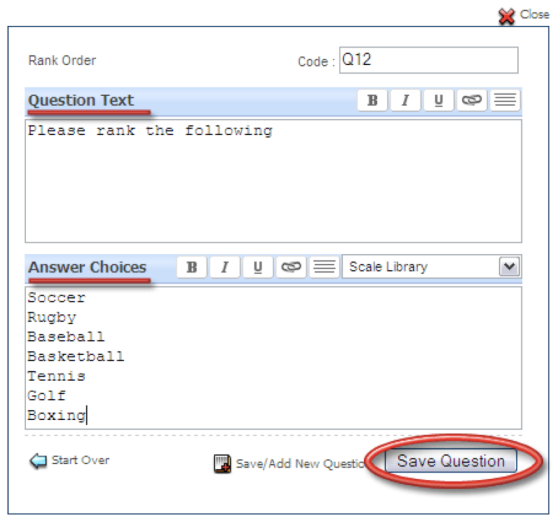
Step 2: From the Standard Question types select the Rank Order question type.

Step 3: Now enter in the Question text and the Answer options and save the question.

Step 4: Create a device key to test on the SurveyPocket app.

Step 5: Pull up the SurveyPocket App on your iPad or iPhone and type in the device key.

Step 6: Pull up the survey in the iPad and view the Rank Order question.

Step 7:  After filling out the survey, make sure to synchronize and to view data online.

If you want to get ahead…

I was in a sales meeting a couple of days ago. We were telling a prospect about our new smartphone interviewing app, SurveySwipe (www.surveyswipe.com). We were talking about apps and how they are used. There were several “old guys” i.e. over 40 and a couple of younger people – under 40 in the meeting. ( For the record I am an old guy – way old). The discussion got onto who uses apps and what they are used for. My point was that apps are the new communication medium, because email is dying fast in the under 40 age group. The older guys didn’t seem to agree, so I asked the younger guy how many apps he had on his smartphone – his answer was “50 – I think”. This clearly shocked the other older guys, they had smartphones but they used them like phones, not as computers to run apps. Smartphones are not phones. Smartphones are personal computing systems which are now the direct channel to respondents and consumers. And email isn’t going to cut it anymore. You need an app to be heard today, because apps are what make smartphones seem smart.  Email is  becoming increasingly just for business use, a bit like Telex (remember Telex ? no ? you didn’t miss much trust me). Like Telex email will fade to be a niche business communication tool. You need an app to get to respondents because each year the young get older and in the same way that email suddenly became THE way of communicating, apps (and social media) are the way to communicate now. Forget email for the under 35’s.

There was a famous psychologist, called Annette Karmiloff-Smith, who said “if you want to get ahead, get a theory”. I’d say if you want to get ahead, get an app !